


Tableau against COVID-19: examples of use and resources available
Hour to hour, day to day, COVID-19 is generating an overwhelming amount of data in many fields: health, services, industry, economy, etc. It is paramount to know how to manage these figures to turn them into information with an added value that contributes to beating the pandemic and its effects. In this context, Business Intelligence tools like Tableau are fundamental. That’s why, in this article we want to show you the resources that this BI solution offers you and some examples of its use in the fight against coronavirus.
Business Intelligence tools like Tableau are shaping up to be a great ally against the COVID-19 pandemic, which is placing our lives, our way of living and how we relate to each other at great risk.
In order for them to be as effective as possible, it is important to use data sources of maximum reliability: WHO, national and regional/autonomous governments, as well as other public organisations. With this verified data, much greater precision is achieved in the process, such as:
- Turning Big Data about the virus into Small Data (in other words, filtering the quality data)
- Identifying patterns
- Discovering new trends
- Building hypothetical scenarios (What-if)
- Making decisions with a high percentage of success
What resources does Tableau offer us to fight against COVID-19?
As one of the main tools of Business Intelligence on the market, Tableau is offering significant help to health organisations and companies to make decisions of the utmost importance with greater reliability and speed.
To begin, Tableau is offering the COVID-19 Data Hub at no cost. It is a resource centre so that any user, public or private, can create dashboards covering the impact of COVID-19 from different perspectives, in fields specific to their activity. To facilitate its creation and development, this resource centre includes a downloadable workbook with an initial dashboard and connection to a flow of data about coronavirus from the John Hopkins University which combines cases from the WHO and centres for disease control of the USA (CDC).
How is Tableau being used against coronavirus? Significant examples
Tableau’s resource centre about COVID-19 also provides examples of the use of this Business Intelligence Software in the context of the pandemic, so they can be used as a guide by any user who want to transform this data into information with a genuine added value to defeat the virus.
Below we mention some examples of how Tableau is being used against coronavirus, broken down by sectors.
Public sector
Numerous national, regional and local bodies are using Tableau to visually show the impact and evolution of COVID-19, as well as the need to stay at home as a preventative measure. Some examples:
- California (USA). The government of this north American state, through its agency of health and social services, has created a dashboard about COVID-19 which allows people to follow the cases of Coronavirus in the state. This control panel is updated daily with the new cases in the different counties, as well as the number of tests carried out.
- New Orleans and Cincinnati (USA). Health and education bodies of these cities are using Tableau to create interactive maps to guarantee that students from infant, primary and secondary education from low income families can have free food. They have set up a network of collection points that is updated in real time with the incorporations of volunteers and the possible absences.
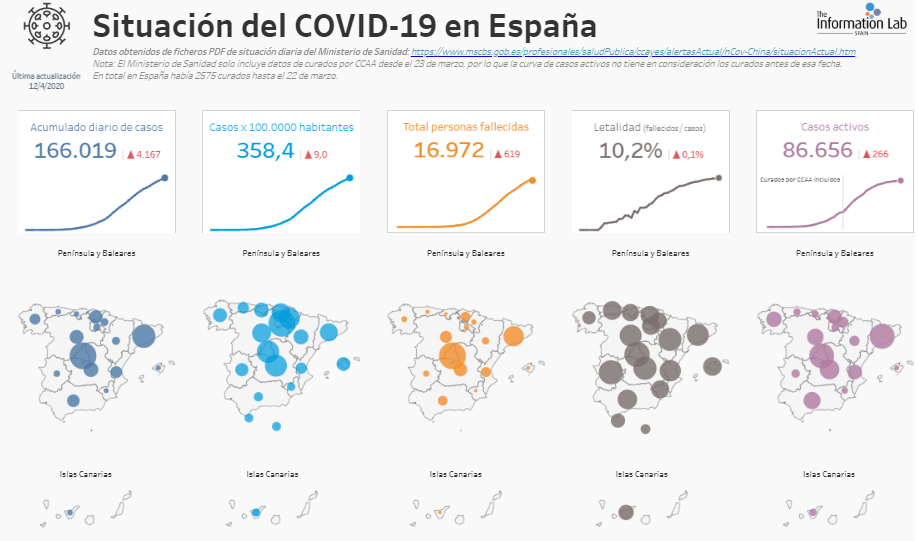
- Spain. Based on the information offered in real time by the Ministry of Health, the company, The Information Lab, has created a complete dashboard about the impact of COVID-19 in the national territory, both overall and by autonomous communities.
- Globally. In accordance with the information made public by different institutions, a Spanish company has developed a portal to detect funding opportunities in the fight against the virus throughout the world.
Social and health services
- Cigna, an important socio-health services provider which serves a population of 95 million inhabitants, relies on Tableau to manage millions of pieces of medical supplies to guarantee that doctors and nurses have the necessary PPI. Prior to the pandemic, Tableau has also been a fundamental factor to improve medical care and significantly optimise the costs of its management (saving up to 145 million dollars each year). See Cigna’s success story with Tableau.
Food: retail sails
- Supermarkets and food chains. These types of company are using Tableau to:
o Prevent the absence of essential products on their shelves, making the relationship with suppliers much more proactive. Based on the history and on current data, they can choose the appropriate supplier for these types of items, knowing the availability of the products and identifying the quality of their deliveries and the rate of delays, for example.
o Know the number in stock of a particular product, its expiry date and the degree of necessity to replace it at the point of sale.
o Improve the productivity of their delivery service to online shopping customers. With a BI solution and combining it with geopositioning tools, they can identify the available distributors in real time and assign deliveries in their area of influence. They can also identify the areas with greater demand and adjust or expand their delivery team to strengthen the routes.
o Improve the supply chain between different establishments of a chain, identifying which centres don’t have stock of essential products and ensuring that those who have them in an acceptable number can supply the former.
Pharmaceutical industry
- A north American pharmaceutical company sends 400,000 test kits to the communities most in need. Thanks to Tableau, it accurately and in real time detects the areas where the pandemic has had the greatest impact, and sends the medical equipment (tests, medicines, etc.) to these areas as a priority. It also identifies the products with a greater demand in each territory, increasing its manufacturing and managing the distribution in each area in accordance with it characteristics.
NGO
- A non-profit organisation from the USA that manages a fund of 200 million dollars is using Tableau to help to keep afloat the small businesses that have had to close suddenly. It relies on the data regarding business activity provided by the north American government to detect the worst affected areas and invest in them as a priority.
- Some NGOs are also using Tableau to find out the progress of the donations for the fight against COVID-19, as well as the best options for investment to help mitigate the pandemic.
Industry
- An important manufacturer with supply chains throughout the world is relying on Tableau to protect the health of 100,000 employees around the world. Thanks to this Business Intelligence software, you can find out in real time, for example, the impact of the virus on staff from different centres and make the best decisions to protect them thanks to this information.
At Intelligence Partner, we want to help to get the most out of the data about coronavirus to turn it into genuine information with added value. It is a key resource to help professionals from all sectors (health, industrial, services, etc.) to reverse the effects of this dangerous pandemic.
Business Intelligence tools are fundamental in achieving this. We have significant expertise in BI and its application with the tools from Google Cloud Platform, Tableau and Locker, that we want to share with you. We would be more than happy to answer any of your queries about this topic. We are stronger together! We will stop this virus together!
