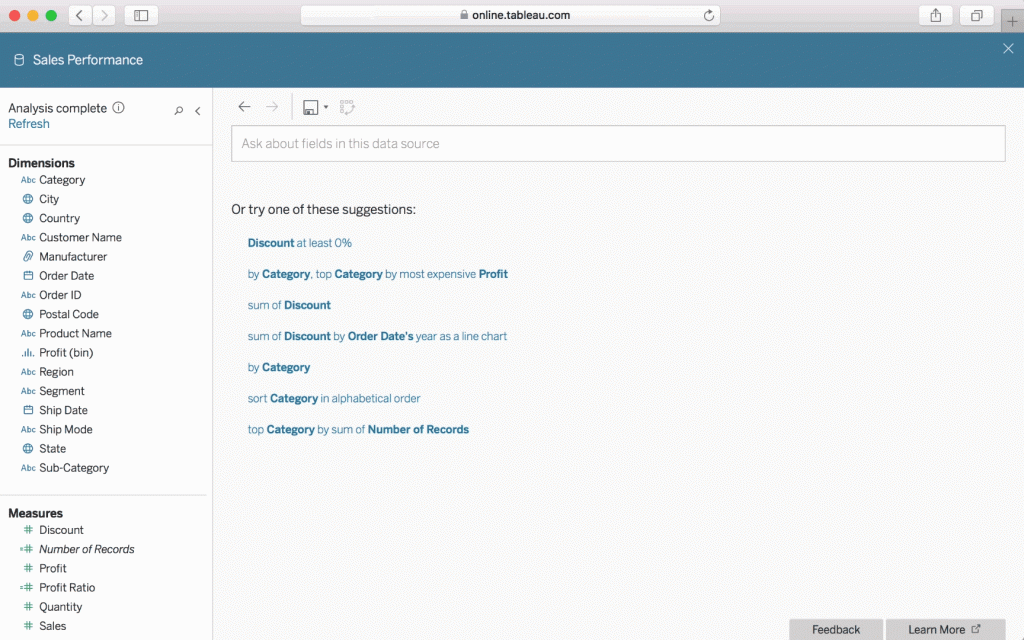
Tableau Ask Data: interacting with natural language in order to analyse business data
In a recent article on Business Intelligence, we commented that being able to tell attractive stories with our data was going to be a trend in 2019. The capacity of speaking with our analytical system in order to extract information from it is also a trend in BI and, today, a reality. The latest launching of Tableau in its 2019.1 update has incorporated Ask Data, which allows us to speak with the data as a starting point, to go into depth afterwards.
Everyone knows of the recent boom in intelligent speakers equipped with digital assistants with which you can now speak in order to enjoy a multitude of services: consumption of music, information, e-commerce, etc. Google Home and Amazon Echo are the stars and their entry in homes is unstoppable. For the moment, according to a recent study from Adobe Digital Insights, 76% of the users of smart speakers have increased their use in the last year. It is used daily by 71% and several times a day by 44%. And they will soon reach automobiles.
This attractive functionality is none other than the application of natural language recognition of an enormous amount of data in order to launch consultations and thus obtain rapid and coherent answers. And what about its application for enterprises?
Tableau Ask Data democratizes even more the access to data
The latest launching of Tableau in its 2019.1 update has been the incorporation of Ask Data, using Natural Language Processing (NLP) so that people can ask questions on the data managed by Tableau, in such a way that they get immediate visual answers in their dashboards.

For the moment, it is only available in English, and we can see it and try it in this interactive demonstration.
Asking questions such as ‘What have been my sales for this month?’, the tool shows the requested information through interactive graphics, which also allow refining the searches even more in order to go into detail.
But the best of all of this is that it is no longer necessary to program or have advanced technological knowledge. The traditional simplicity of the Tableau user interface goes beyond, democratizing the use of the data to be used by a larger number of persons. Its use is not reduced exclusively to data scientists and advanced analysts. Now the limit will not be my knowledge on the analysis, but rather the breadth of my own questions.
Beyond the keywords: analyse the intentions and the user context
For this analysis, sophisticated algorithms are used that are based on the understanding of the user’s intentions as well as the context of the conversation, without interpreting only the keywords, which allows more relevant results.
In addition, automatic learning (machine learning) is applied so that, with the passing of time, the knowledge of the domain improves, taking into account the company’s data and the types of questions that the users formulate.
Today, Tableau Ask Data is constructed to work with data sources published in Tableau Server and Online, and already supports all these analytical expressions:
- Aggregation expressions: The values of multiple rows are grouped together to form a single value based on a mathematical function. For example, “Sum of Sales,” “Average Profit,” or “Count of Customers.”
- Group expressions: Expressions that partition the data into categories shown in a data visualization, like “by Region” or “by Sales.”
- Sort expressions: Expressions that arrange data rows in an order, such as ascending, descending, or alphabetical. For example, “sort products in ascending order by sum of profit” or “sort customer name in alphabetical order.”
- Filter expressions: Expressions that return a subset of the field’s domain. They can be numerical filters like “sum of sales at least 2,000 euros” or categorical filters like “customer name starts with Pedro” or “Category contains manufacturing.”
- Limit expressions: Expressions akin to filters that return a subset of the data, restricting in this case a subset of rows. For example, “top 5 wineries by sum of their sales” or “bottom category by average profit.”
It is sufficient to select a data source and prepare a question. It is not necessary to configure anything.
That’s it. Ask Data users will have much more success in the answers to their questions when the data have been carefully curated by a data steward or analyst who understands how to prepare the data for analysis and can anticipate the kinds of questions users will ask of the data using natural language.
On the other hand, the semantic model that is part of Tableau automatically enriches the data in order to have more natural interactions, You can even add synonyms to your own data.
As for security, Ask Data has the same measures implemented in Tableau Server and Online. The answers will not present data to which a determined user does not have access.
Do you want us to help you prepare your data for this new spectacular analysis capacity? We will be happy to help you.


