


Business Intelligence
Data as a Service (DaaS)
Scroll down
Data as Service (DaaS) with Tableau, Talend & Google Platform
At Intelligence Partner, we help companies and people to make sense of the data they analyse (DaaS), using Tableau, Talend and the Google platform.
We are involved throughout the data life cycle and, therefore, we can offer a service that adapts to your needs:
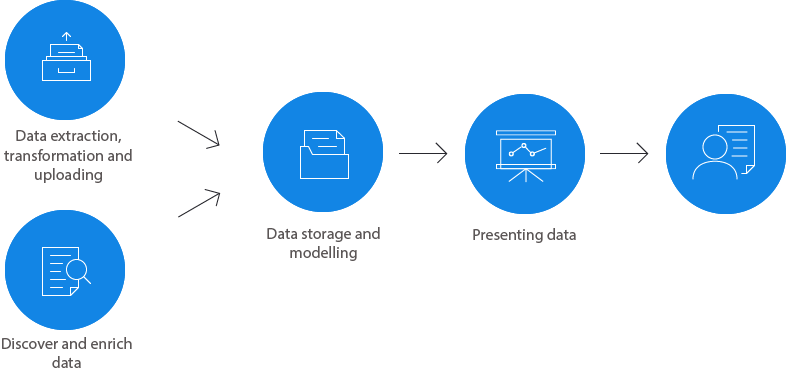
- Data Extraction, Transformation and Uploading: Your data can be “dirty”, lack consistency or be structured in a way that does not facilitate analysis. Our consultants are experts in processing, cleaning and modelling data for analysis with Tableau. We use Talend to upload it, an open source solution that you can use and develop yourself.
- Data storage and modelling: What if your data is not organised/modelled so that they can be easily represented? What happens if every query takes minutes to be answered?
At Intelligence Partner, we are experts in defining and designing the best analysis models (how to organise and store data) so that analysts can ask what they want and receive an answer in just a few seconds.We are experts in working with this modelling system through Google’s cloud services: We use Google BigQuery to analyse thousands of millions of structured records, or Google Cloud SQL for more traditional relational databases, or Google Cloud BigTable for unstructured and non-SQL environments.
- Discover and enrich data: Once we apply Machine Learning techniques or Data Mining algorithms, we can discover valuable information that enriches the data. These algorithms are used to make sentiment analyses of written texts in social networks, etc., as well as to create clusters of customers or potential customers, based on behavioural patterns.Intelligence Partner, as a Google Cloud Premier Partner, has the know-how to propose the best approximation and the best algorithm in order to help you in this process to “discover or enrich” data. From the use of ‘R’ as a statistical environment, to the use of Google’s Natural Language API to perform sentiment analyses on texts found on social media.
- Presenting data: Once we have the suitable analytical model, the presentation takes place through metrics and KPIs (key business indicators) displayed via Dashboards in ad-hoc reports.Our consultants have developed this set of reports for a number of sectors, such as the finance, telecommunications, leisure and culture, or the distribution sector. In addition to being Tableau certified, they share a passion for “expressing themselves through graphics, in a visual format”. Thus, the reports we prepare convey the message and conclusions by engaging the “audience”.
