


5 steps to import your own map in Tableau
As a consultant firm, we have often encountered cases where our customers have mentioned the need to display images or maps in Tableau other than the default options that come with the tool.
Since Tableau can import maps, images, and even connect with GIS services that are external to the app and work with them from within the App, we are going to dedicate this post to explain the 5 steps that will allow any user to import their own images or maps into Tableau and work with them comfortably.
To illustrate our example, we will use a map, but not a geographical map in this case, but the layout of seats in a theatre.
Step 1 – Select the image or map you want to import to Tableau
Once you have chosen the image you wish to use as a map, you must adapt it to the dimensions required by the user. These measurements will be recorded in Tableau to display the map in the desired size. For example, the image below is 450 pixels wide by 450 pixels high.

Step 2 – Group the data around the X and Y coordinates
The next step is to create a dataset that has at least three fields:
- Each point that you want to display (in our case it will be the seats in a theatre grouped by category).
- X Position
- Y Position
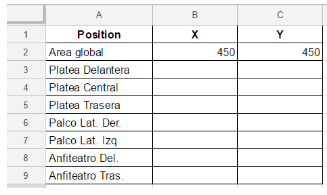
For the first row, simply write any name (e.g. general area) and note down the maximum values of X and Y, i.e. 450. Value X will be used to define the width of the image and value Y the height of the image. At this point, the resulting dataset should look like this (we shall calculate the coordinates of the location of each area in the theatre later):
Step 3: Add the background image in Tableau
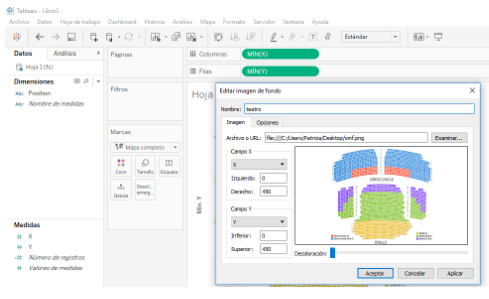
Begin this stage by creating a new book in Tableau and connecting to the data in step 2. Then, click on the Map>Background images tab and click on the data source. This will open a new dialogue box where you can select the ‘Add image’ option in the lower left-hand corner. Use this option to select the background image.
Now, you only have to provide the maximum value of the X and Y coordinates to complete this step. If your map is of 450 wide by 450 high, as in the example, you would have to make the following entries:
- X Position: 0 Left, 450 Right
- Y Position: 0 Bottom, 450 Top
At this point, your screen should look like this:
Step 4 – Find positions X and Y for each Map coordinate
Start your new custom map in Tableau by placing the X measurement in the columns and the Y measurement in the rows. Here, it is important to pay attention so that both axes are fixed to the maximum values for X and Y; which in the case of the example would be 450 on both axes. If you need to change an axis, simply right-click on it, select the “Edit” option and set the range between 0 and 450.
To search for the X and Y coordinates of each seat in the theatre (continuing with the example), right-click on the view, select the “Note” option, and click on “Point”. If the X and Y measurements are the only fields in the view, the annotation will show the X and Y values by default. Now, drag the end point of the annotation to each location you want to trace, and you will see how the X and Y values change. Use this information to register the coordinates in Excel/csv.
This would be a summary of all the X and Y coordinates for each location in the theatre:
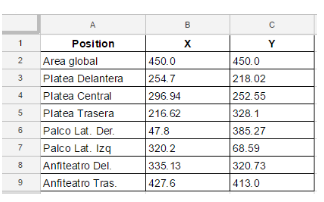
Bear in mind that it is not necessary to register all decimal places.
Step 5 – Update your map
Once all the coordinates have been recorded in your dataset, save the data and update the data source in Tableau.
By following these simple steps you can start to work using your own maps in Tableau in a matter of minutes. If you should need more information on this subject or specialised advice, please contact Intelligence Partner; we will be pleased to help you.
